Dine Crafted
Food Cost
Understanding Food Cost Percentage
Learn how to calculate food cost percentage, cost each dish with a recipe card, track waste and variance, and keep your margin steady with worked examples.
15 October 2026 · 4 min read
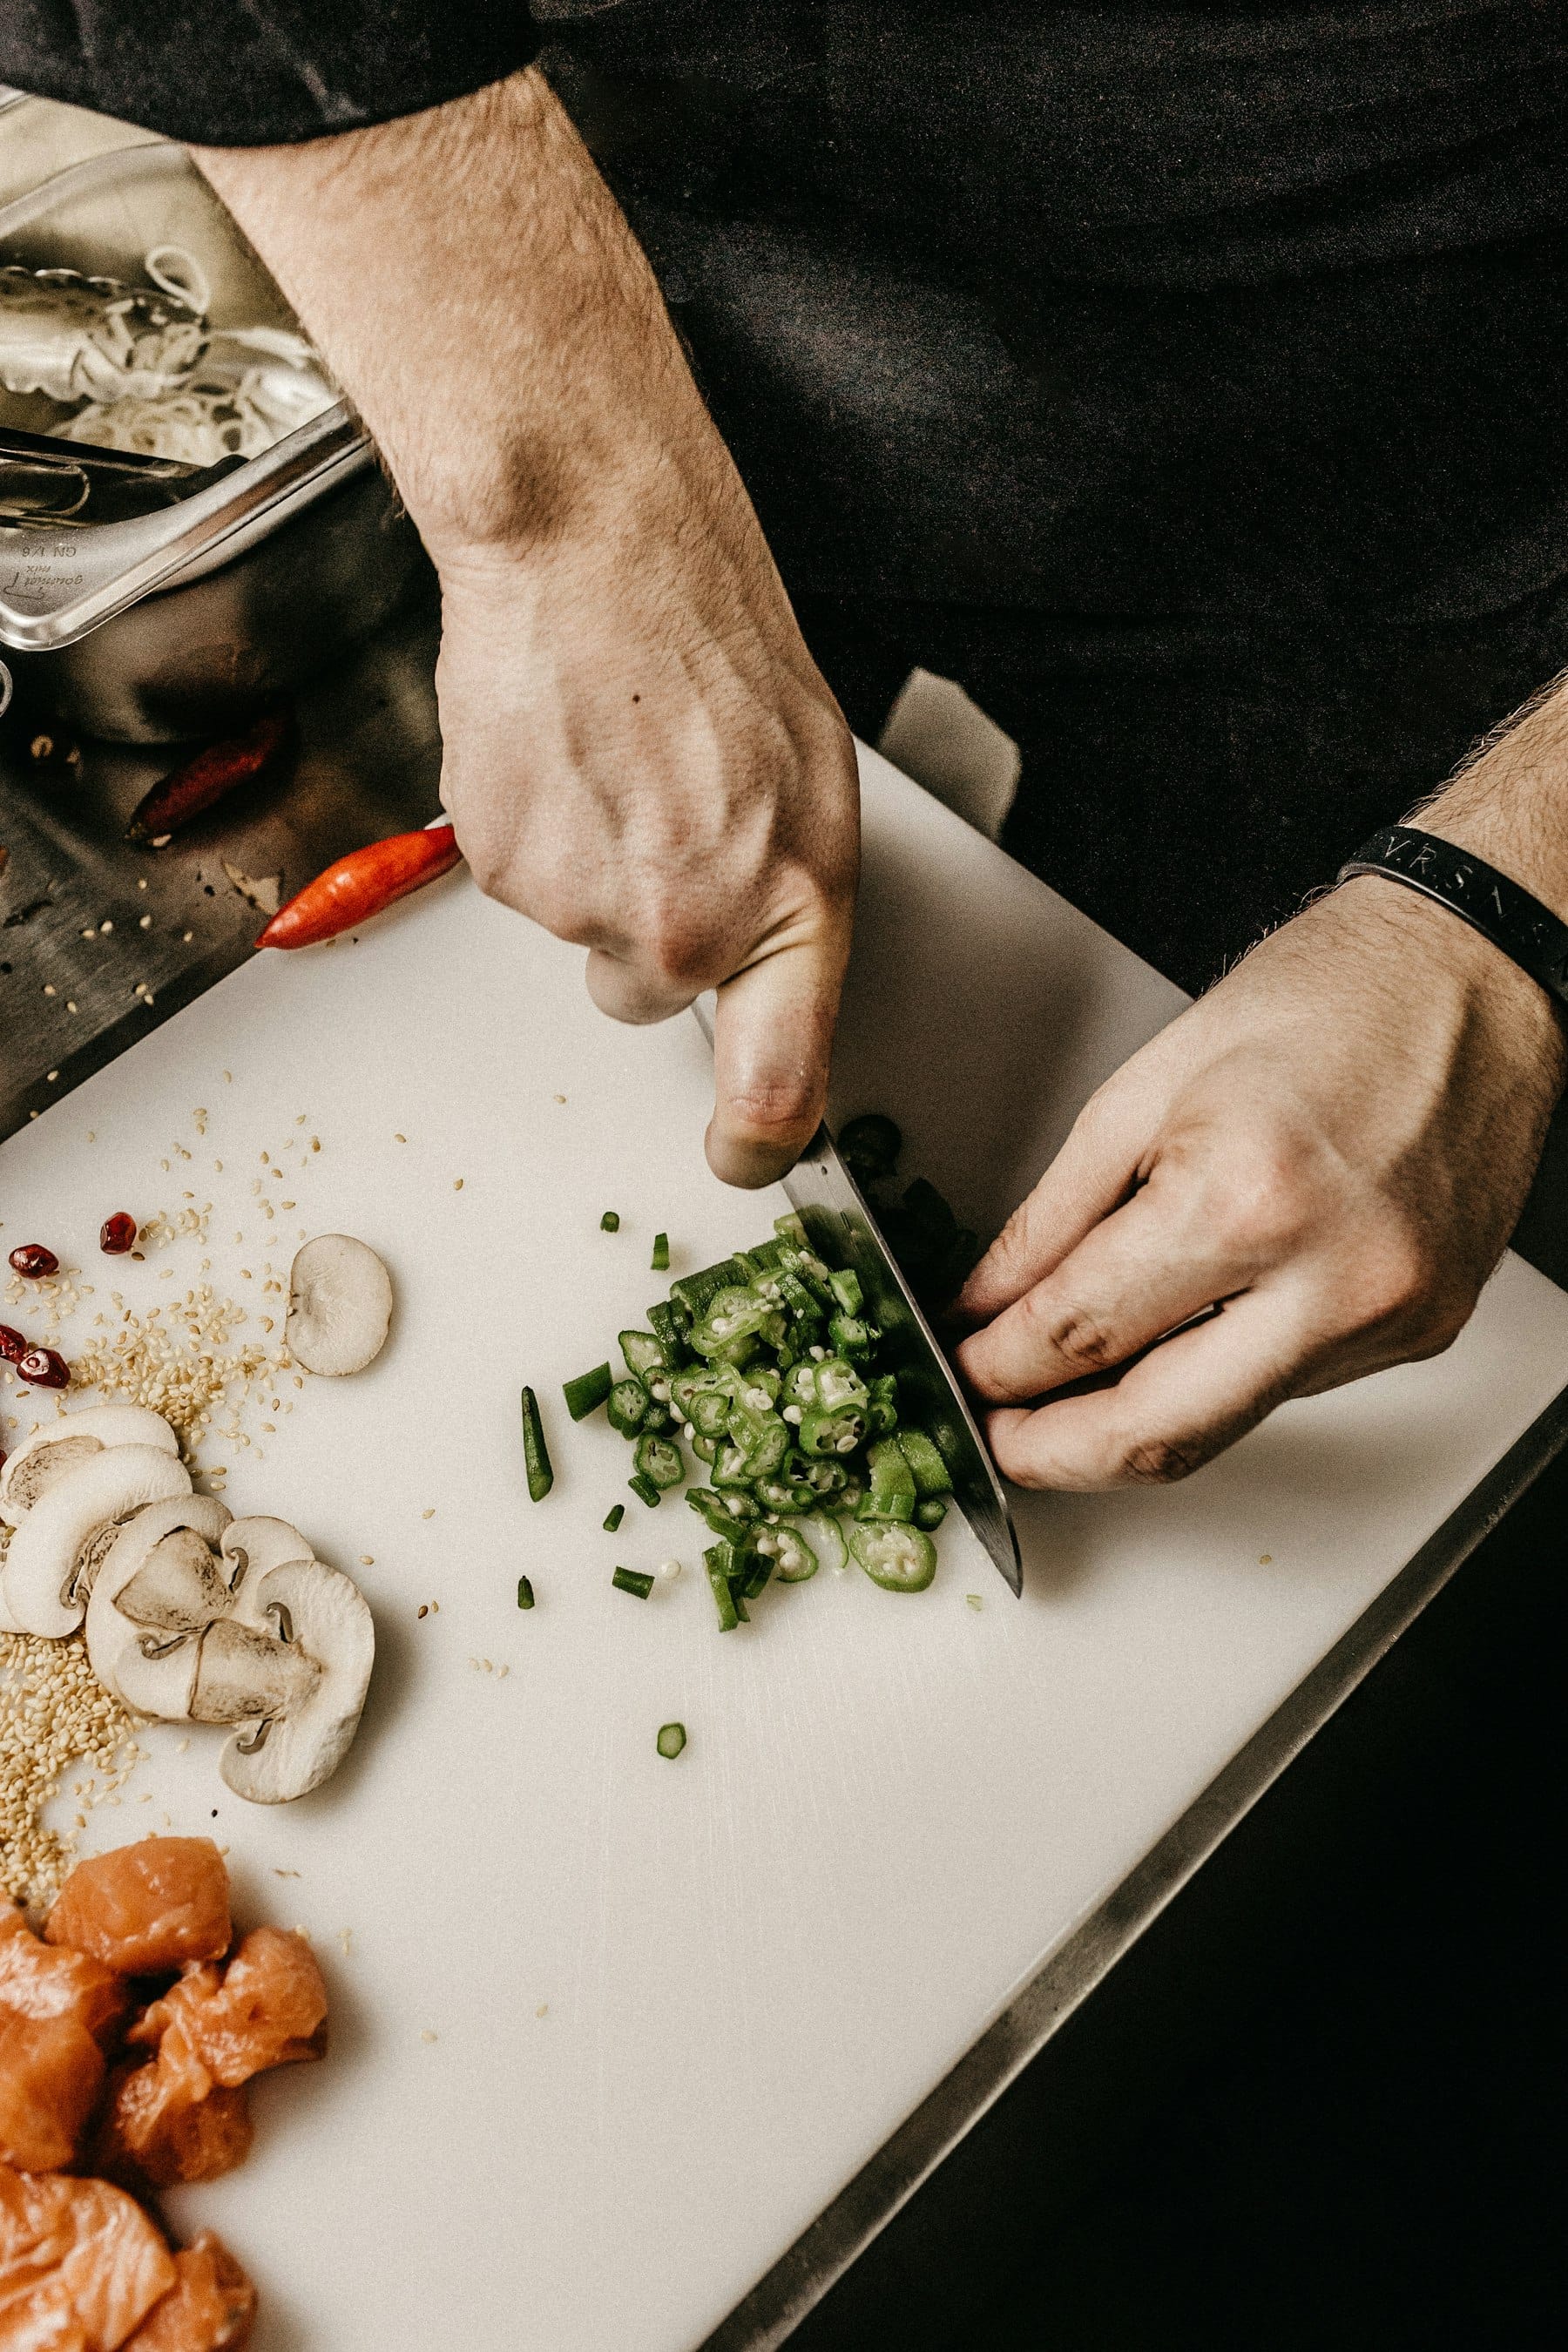
Food cost percentage tells you how much of every rupee of sales goes into the ingredients on the plate. It is one of the most useful numbers in a kitchen. It is also one of the most misunderstood.
This guide explains the formula, shows a worked example, and covers why the number drifts. All percentages are rules of thumb or illustrations, not promises.
The basic formula
Food cost percentage = cost of ingredients divided by selling price, multiplied by 100.
Worked illustration: a paneer sandwich uses ingredients costing ₹58. You sell it for ₹180 before tax.
58 divided by 180 equals 0.32, so the food cost is about 32 percent.
That means ₹122 of the ₹180 is left to pay for rent, salaries, utilities, platform charges, marketing and profit.
What is a good food cost percentage?
There is no single right answer. A rule of thumb used by many operators is somewhere in the region of 28 to 35 percent for many formats. Beverages often run lower. Some premium or protein-heavy dishes run higher.
What matters is not hitting a magic number. It is knowing your number by dish and by category, and making sure the overall mix covers your other costs. A menu with a few high-cost hero dishes can still work if the rest of the menu balances it.
Step 1: Cost every dish with a recipe card
A recipe card lists every ingredient, the exact quantity, and the cost of that quantity. Without it you are guessing.
A good recipe card has:
- Dish name and portion size.
- Each ingredient with weight or count.
- Current purchase price per unit.
- Cost per portion.
- Yield after trimming, cooking or cleaning.
Account for yield
You do not use what you buy. Vegetables lose weight when trimmed. Meat loses weight when cooked. If you buy 1 kg of vegetables and 800 g is usable, your real cost per usable gram is higher than the shelf price suggests.
Illustration: a vegetable costs ₹60 per kg and yields 80 percent. The usable cost is 60 divided by 0.8, which is ₹75 per usable kilogram.
Include the small things
Oil, spices, sauces, garnish, packaging for takeaway and delivery. These look tiny and add up. A sauce sachet or a container can move a dish by several percentage points.
Step 2: Separate theoretical from actual
There are two food costs.
- Theoretical food cost: what the recipe says it should cost for what you sold.
- Actual food cost: what you really spent, based on stock movement.
Actual food cost formula: opening stock plus purchases minus closing stock, divided by sales.
Illustration: opening stock ₹80,000, purchases ₹2,40,000, closing stock ₹70,000. Ingredients used = ₹2,50,000. If sales for the period were ₹8,00,000, actual food cost is about 31 percent.
If theoretical is 29 percent and actual is 31 percent, the gap of two points is your variance. That gap is money disappearing.
Step 3: Find out why variance happens
Common causes:
- Over-portioning. Cooks add a bit extra, daily.
- Waste. Spoilage, burnt batches, trimming mistakes.
- Theft or untracked staff meals. Handle through simple controls and a clear staff meal policy.
- Wrong recipes. The recipe card does not match what is actually cooked.
- Price creep. Suppliers raise prices and your menu does not.
- Billing errors. Items served but not billed.
Track these weekly, not yearly. Small leaks are easy to fix early.
Practical controls that work
- Weigh and measure key ingredients. Use portion scoops and standard containers.
- Count stock weekly, and high-value items such as dairy, meat and coffee more often.
- Record wastage in a simple log with a reason for each entry.
- Review supplier prices monthly and compare quotes. This is where good procurement pays for itself.
- Train the team on recipe cards. Standards only work if people know them. See how to create restaurant SOPs.
Food cost and pricing are linked
If food cost rises and you leave prices unchanged, margin falls. If you raise prices without thinking, you may lose volume. The better approach is to look at the whole menu. Which dishes sell well and earn well? Which sell well and earn poorly? Our article on how to price a café menu walks through this.
Delivery changes the maths
Dishes sold through delivery apps carry extra costs: packaging and platform charges, which are set by each platform and change over time, so confirm them directly. A dish at 32 percent food cost in the café may look very different once you add those costs. Many operators price delivery menus separately for that reason.
Common mistakes
- Costing a dish once and never updating it.
- Using the retail price of an ingredient instead of your actual purchase price.
- Ignoring yield and trimming loss.
- Forgetting packaging.
- Judging the whole kitchen by one number instead of by category.
- Cutting quality to hit a percentage, which can cost you repeat customers.
A short weekly routine
- Monday: count stock and compare with the previous week.
- Midweek: review the wastage log.
- Friday: check top-selling dishes and their cost.
- Monthly: refresh supplier prices and recipe costs.
Fifteen minutes a day beats a long panic once a quarter.
How Dine Crafted helps
Dine Crafted builds menu engineering and procurement into the launch of every owner-built café and restaurant. That means recipe cards, costing and supplier comparisons are set up before you open, not after the margin has already slipped. We are not a franchise, so the recipes and the brand are yours.
Next step
If your food cost is unclear or drifting, start with a clean look at your menu and your suppliers. Our procurement service helps you compare vendors, standardise specifications and keep costs under watch.